In 2020, Johnson and Johnson spent $20.08 billion on sales and marketing. This is equivalent to 26.7% of the company’s total revenue.
Without exaggerating, marketing takes up a considerable percentage of your expenses. Even if your B2B company only has its revenues in millions.
Ultimately, you want to acquire much more revenue as a result of your marketing investment. After all, no business wants to flush money down the drain.
However, measuring B2B marketing ROI isn’t always straightforward. Sometimes, you have to uncover statistics and do basic calculations to arrive at your ROI.
Measuring B2B marketing ROI isn’t always straightforward. Sometimes, you have to uncover statistics and do basic calculations to arrive at your ROI. Share on XLuckily, we have compiled essential information you need to calculate ROI effectively, whatever your campaign goal may be.
Let’s go into all the details.
What is B2B Marketing ROI?
B2B marketing ROI is the percentage of the difference in revenue and marketing costs compared to marketing costs. Simply, it’s the amount of revenue a company obtains as a result of spending an amount on marketing.
For business-to-business (B2B) companies, obtaining marketing ROI can be more difficult compared to B2C companies. This is usually because of the longer sales cycles for B2B products.
For instance, the time between the first contact with a prospect and the sale can take more than 6 months. How do you measure ROI effectively in such a situation?
Sure, it’s possible. But it requires a lot of work to get all the numbers right.
What does marketing ROI measure?
B2B marketing ROI measures the amount of revenue you generate for every dollar you spend on marketing. Generally, the target is to make much more than a dollar on every dollar you spend marketing.
Here’s a simple formula for marketing ROI:
B2B marketing ROI = (revenue – marketing spend)/marketing spend × 100%
In most cases, your marketing ROI for a particular campaign will depend on your campaign goals. If your campaign goal is to drive traffic to your website, what’s the value of a website visitor?
If you’re running a lead acquisition campaign, how much is a lead worth to your business? It’s usually easier to measure ROI if your goal is sales generation.
Whatever your campaign goal, a poor marketing ROI calls for further analysis of your marketing strategy.
Are you marketing on the right channels? Are you marketing to your ideal audience?
After answering these and more questions, you can take steps to improve your ROI in future campaigns.
B2B digital marketing ROI benchmarks
Perhaps, one question that will cross your mind is: what’s a great B2B marketing ROI? Frankly, there’s no straight answer to that question.
What constitutes a great ROI for your business depends on various factors. That said, you should shoot for a B2B digital marketing ROI of 5:1. This means obtaining a revenue that’s 5 times your marketing spend.
One good reason for this benchmark is that it increases your chances of making profits. To create a profitable marketing ROI benchmark, you need to consider the cost of goods sold (COGS).
If your products have healthy profit margins, you can have a ratio lower than 5:1. However, you should keep that ratio if you’re promoting products with a thin profit margin.
Another way to create a marketing ROI benchmark is to use your historical ROI performance. In this case, you look at your previous campaigns’ ROI and set targets to improve on it.
Generally, you should shoot for an ROI that makes your business profitable after considering marketing and production costs.
How to calculate marketing ROI for B2B businesses
Calculating marketing ROI for your B2B business requires that you execute some tasks. Of course, there are many metrics you can uncover. This depends on the tools you use and the data you need.
Here are some tasks to keep in mind to calculate marketing ROI effectively:
Set up website analytics
For most of your marketing campaigns, your website is where the most critical actions happen.
Say you run email nurturing campaigns, you want recipients to visit your website and buy your products in the future. Even if you run brand awareness campaigns on social media, you want to get people to your website.
That’s why there are many traffic sources to websites. LinkedIn, Facebook, YouTube, organic search, paid search, and many others.
But to see all these important numbers, you need to set up your website analytics. You can achieve this by installing an analytics tool’s tracking code on your website.
For most people, though, Google Analytics is a free and robust tool that meets their website analytics needs. In this post, we’ll refer more to Google Analytics.
First, how do you install Google Analytics into your website? Visit the Google Analytics website and sign in with your Gmail account.
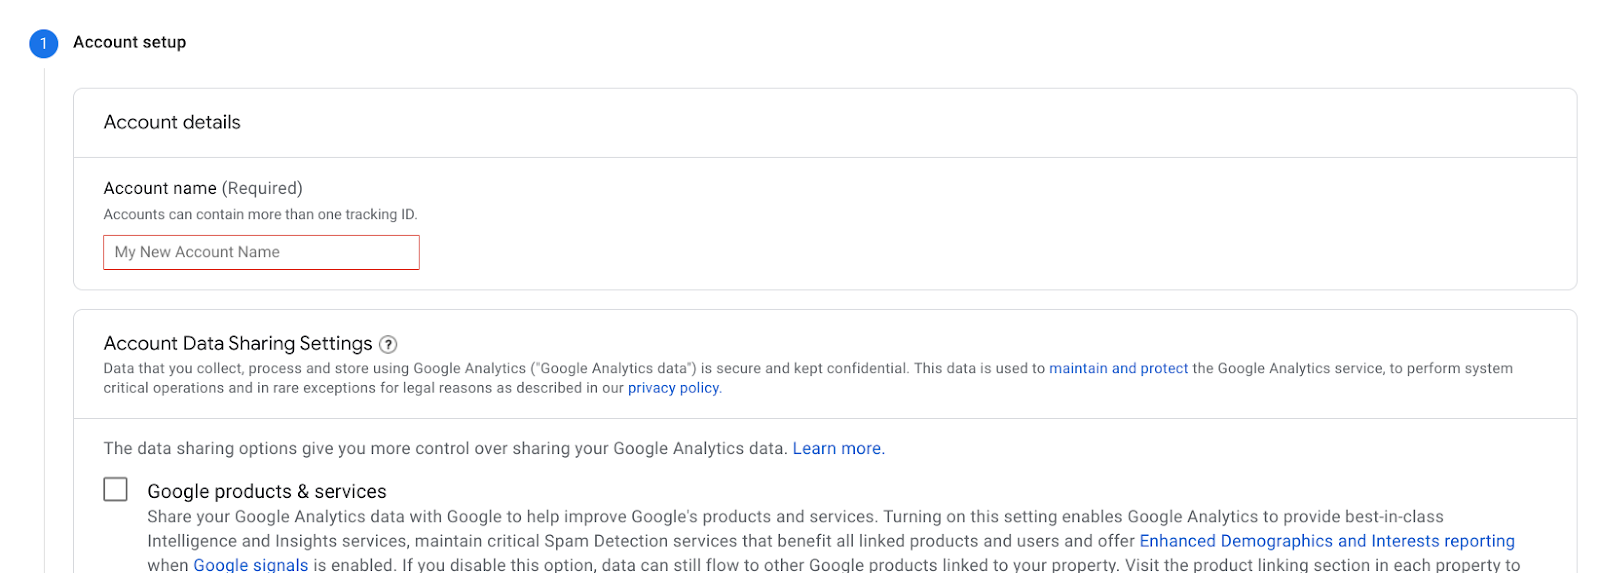
After doing this, you can get started with setting up your Google Analytics account. The first section is the account setup where you can enter the account name and select data sharing options.
The next sections are the property setup and telling Google about your business. When you’re through with this, Google will provide a tracking code that you’ll enter into your website.
Luckily, Google will provide instructions on how to install the code. Once you finish the setup, you’ll start seeing metrics on your Google Analytics dashboard.
Define your key performance indicators (KPIs)
Before running marketing campaigns, you need to set SMART goals. These goals improve the chances of running successful campaigns.
Luckily, a SMART goal is specific and measurable through key performance indicators (KPIs). Key performance indicators are ways to judge the success or failure of your campaigns.
Of course, your KPIs will depend on your campaign goal. Then, your KPIs should be connected to metrics from your campaigns.
Some common key performance indicators include:
- Number of leads captured
- Amount of sales
- Customer acquisition costs
- Customer lifetime value
- Website traffic to lead ratio
- Marketing qualified leads to sales qualified leads ratio
- Website traffic
- Social media engagement
- Email conversions
- Landing page conversions
After defining your key performance indicators, it becomes easier to track the right metrics.
Set goals on Google Analytics
When visitors land on some of your pages, it’s because they’ve taken a preceding action. For instance, when visitors land on a “thank you” page after submitting their details in a form or completing a purchase.
In these cases, visiting these pages means you’ve achieved a campaign goal. With Google Analytics, you can set and track these goals.
Beyond tracking a URL destination, there are other goals available on Google Analytics. In a nutshell, the 4 types of goals you can set include:
- Destination
- Duration
- Pages/screens per session
- Event
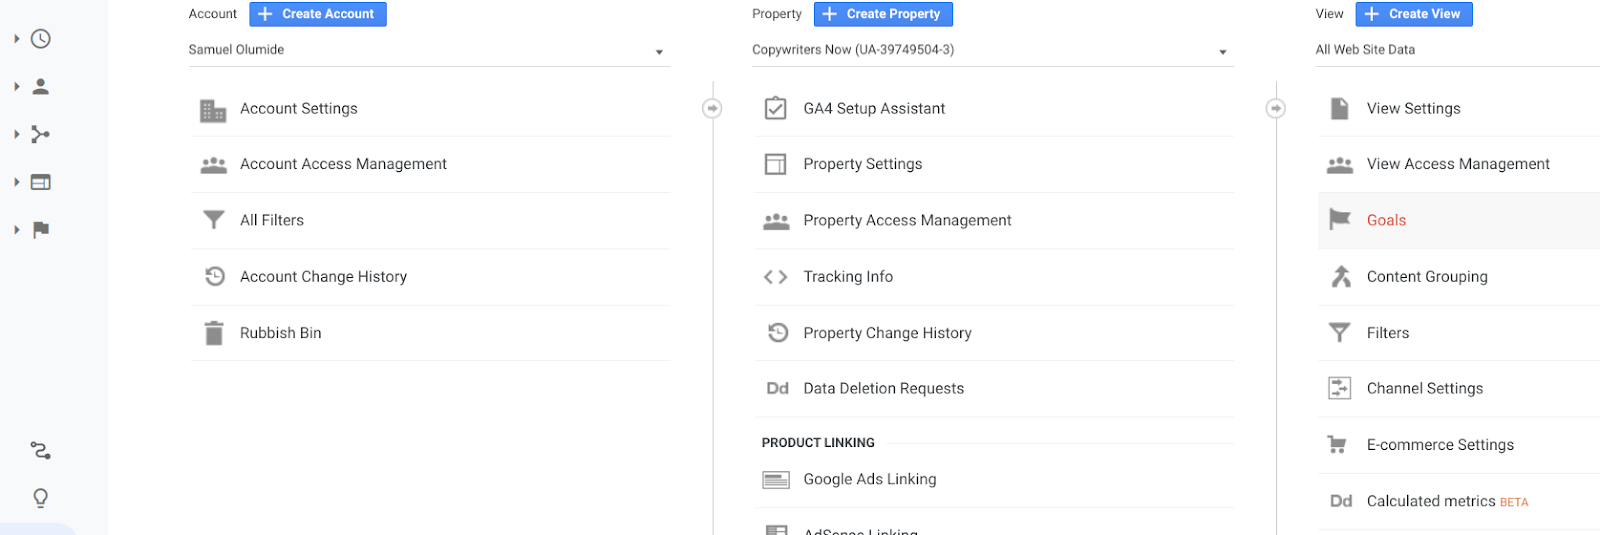
To set a goal, navigate to your Google Analytics dashboard and select a website. Once you do that, click on “Admin” at the bottom left corner of the page.
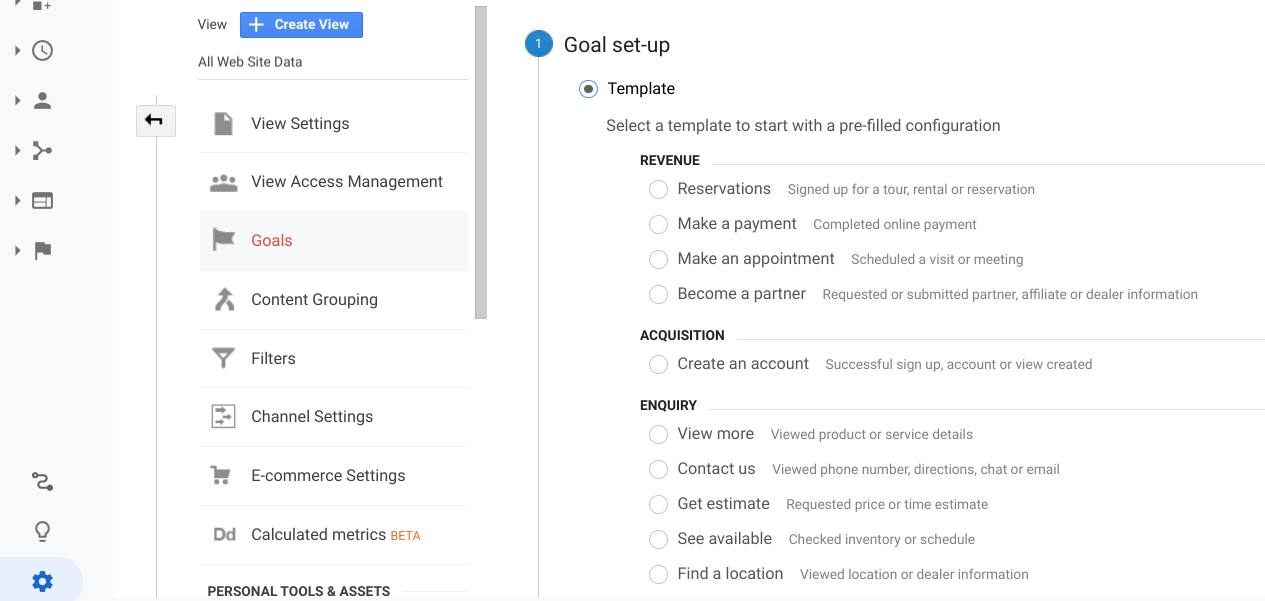
Doing this will bring up options. Click “Goals” to continue. After this, click on “+ New Goals” on the next page.
Then, you can set up your goal. Here, you’ll complete sections such as goal setup, goal description, and goal details.
In the “Goal details” section, you can enter a value for your goal. For instance, if a lead is worth $1,000 to your business, you can enter that as the goal value.
After entering these details, click “Save” to complete your setup.
Check paid traffic conversions
On your Google Analytics dashboard, you can check for traffic sources on your website. Apart from that, you can see how visitors from these sources behave during their visits.
If you run paid campaigns, this is one way to track their effectiveness. Some popular paid campaigns you can run include paid search, paid social, sponsored content, and more.
How do you check for these sources on Google Analytics?
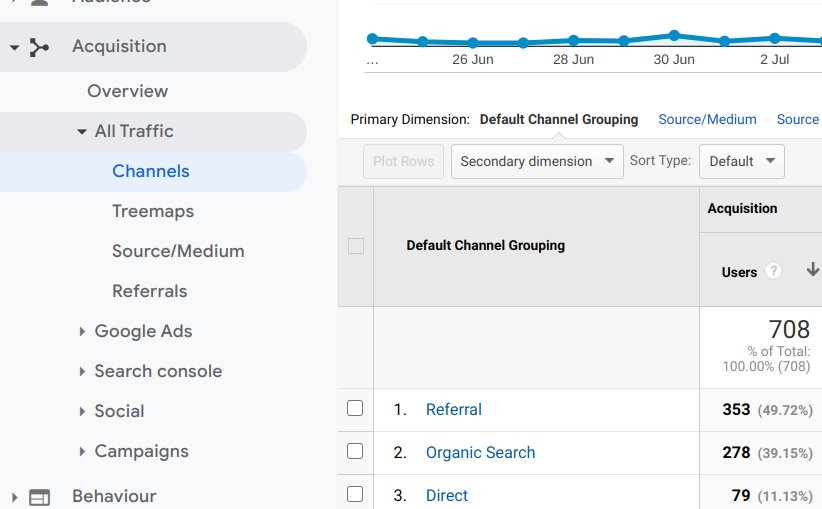
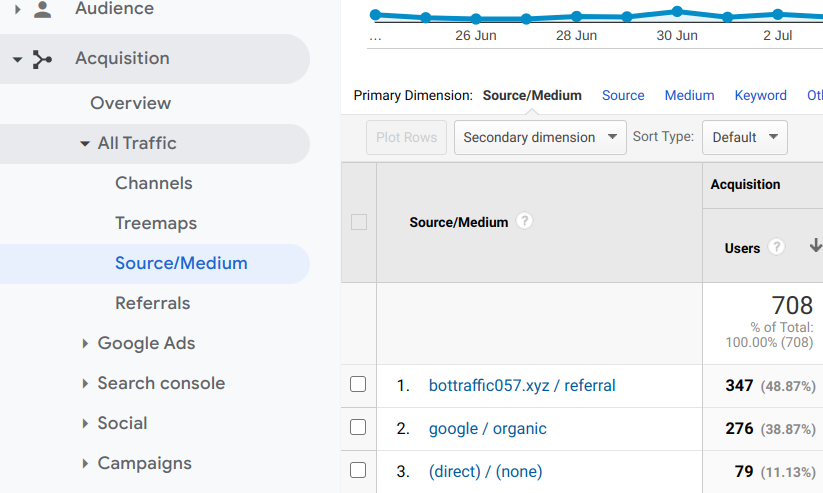
Visit your dashboard and click on the “Acquisition” drop-down at the left sidebar. Then, select “All Traffic” and “Channels” among the options.
Here, you’ll see the main sources of traffic to your website. To dive deeper into the referral sources, click on “Source/Medium” among the options.
In the “Behavior” section, you can check your landing pages and their sources of traffic. Also, if you use UTM parameters for your campaigns, you can know the traffic source to specific pages.
Calculate ROI for different marketing campaigns
Apart from calculating the overall marketing ROI for a specific period, you should consider individual campaigns too. While your boss needs the overall ROI, you need individual campaign ROI more.
After all, some marketing campaigns will result in far higher ROI compared to the average. On the other hand, some will have far lower ROI compared to the average.
Identifying individual campaigns’ ROI will affect how you prioritize your budget allocation. For instance, it makes sense to allocate more to campaigns with high ROI.
For campaigns with low ROI, you can carry out further analysis to understand the causes for poor performance. In a nutshell, you should track campaign ROI on different channels and see how effective each channel is.
Identifying individual campaigns’ ROI will affect how you prioritize your budget allocation. For instance, it makes sense to allocate more to campaigns with high ROI. Share on XCheck assisted conversion sources
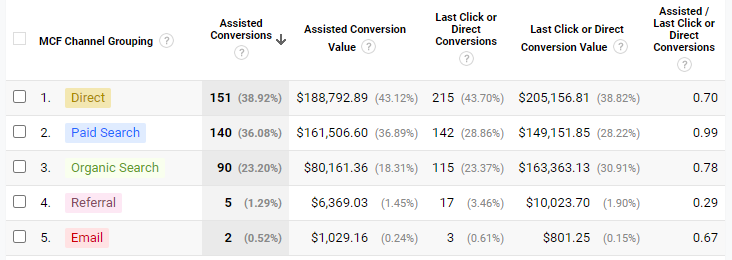
Usually, when you look through your traffic sources, you can see the number and value of conversions through these sources. However, in most cases, there is more than one source responsible for conversions.
For instance, a customer may see a social media post praising your tool for its effectiveness. This individual may then perform searches to explore other products with the same function.
If the customer ends up buying your product, Google will credit organic search with the conversion. As a B2B company, you need to know channels that assisted in the conversion.
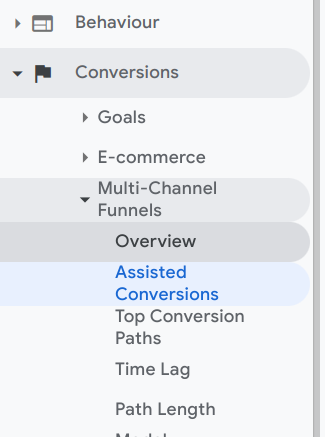
The assisted conversion metric provides details about how marketing sources had an impact during the buyer’s journey. To access this report on Google Analytics, click on “Conversions” and “Multi-Channel Funnels” drop-down at the left sidebar. Then, select “Assisted Conversions.”
In a case where a channel accounts for many more assisted conversions than direct, this will show its importance in the overall buyer journey.
5 best ways to measure your marketing ROI
While marketers obtain numbers about their marketing campaigns, they approach ROI measurement differently. Here are 5 of the most popular approaches marketers use right now:
1. Single attribution models
If you’re looking for a straightforward way to measure your B2B marketing ROI, then this attribution model will meet your needs. The single attribution model credits a single marketing touch for turning a lead into a customer.
This model considers these two touches:
- First marketing touch: in this case, marketers consider the first touch of a customer during the buyer’s journey. Usually, this is the marketing channel that converts an individual into a lead.
- Last marketing touch: this attribution model takes account of the final marketing touch in the buyer’s journey. Put simply, this is the last marketing channel a prospect has contact with before buying.
While the single attribution model is easy to execute, it’s too simplistic for B2B products. For B2C products with short sales cycles of about a week or less, this model can work well.
However, B2B products require long sales cycles that can run into 6 months or more.
So, considering lead nurturing costs, the first or last touch may just be a fraction of your marketing costs. Using a single attribution model can lead to inaccurate marketing costs and ROI measurement.
2. Single attribution with revenue cycle projections
This attribution model is similar to the first on the list. The major difference is that you’ll consider historical revenue performance.
For instance, say you use the first touch model, and an individual becomes a lead through Facebook lead ads. In such a case, you can look at the average amount a customer through Facebook lead ads has spent in the past.
With this model, it’s easier to make ROI projections.
3. Customer lifetime value and customer acquisition costs calculation
Unsurprisingly, this is one of the most popular ways to measure marketing ROI. Whatever your B2B marketing campaign goal, you can effectively calculate your ROI with this model.
First, you have to calculate your customer lifetime value (CLV). Your business customer lifetime value is the average amount a customer will spend with your business during their time as a customer.
For campaigns where you have other goals apart from sales or customer acquisition, you need to calculate your average lead value. To derive this value, calculate your lead-to-customer conversion rates.
Multiplying your lead-to-customer conversion rates by your customer lifetime value will result in your average lead value.
If your campaign goal is to drive more web traffic, then you need to calculate the value of an average visitor. You can multiply your visitor-to-customer conversion rate with your customer lifetime value to know the value of a visitor.
Once you complete these calculations, the next step is to calculate your marketing costs for a period or campaign. With these values, you can calculate your ROI using the marketing ROI formula.
4. Multi-touch attribution model
In this model, you’ll consider all the marketing touches a prospect had contact with before becoming a customer.
To know these marketing touches, check a customer’s buyer’s journey. With customer relationship management (CRM) tools, it’s easy to track all your interactions with prospects and customers.
One of the best CRM tools you’ll find on the market today is HubSpot. The tool allows you to create contacts as they become leads.
Better still, contacts’ details populate automatically as you interact with them. Therefore, you can easily track all the marketing touches a prospect has before converting to a customer.
After identifying the touchpoints, all you need to do is divide the revenue from the customer across the touchpoints. For example, if there were 5 touches before you convert a customer, you’ll divide the revenue from the customer by 5 and assign to each touch.
Some businesses using multi-touch attribution give weight to touches for different reasons. This could be the proximity of the touch to conversions.
For example, if a prospect downloads a product brochure one week before buying, that will carry more weight than a landing page they visited 6 months ago.
Another way to assign weight is how much prospects interacted with a marketing touch. For instance, say 70% of your interactions took place through a marketing channel. This channel will have more weight than the 4 touchpoints that accounted for 30% of interactions.
However, assigning weights to touchpoints can make your ROI calculations complicated. So, it’s usually more practical to give touchpoints equal weights in your ROI calculations.
Market mix modeling
The market mix modeling considers all the marketing and non-marketing touches involved in making a sale. This model tries to take account of any element that affects a company’s revenue.
Some common considerations for this model include:
- Product
- Pricing
- Place
- Promotion
- Logistics
- Competitors
- Sales
- The economy
- Staff members
This model tries to be as thorough as possible when measuring ROI. To achieve accurate results, the marketing mix model requires different statistical techniques such as regression.
Due to this level of detail, the marketing mix model is the most accurate way to measure your B2B marketing ROI. At the same time, its complexity means only a low number of marketers implement it.
B2B Marketing ROI Calculator
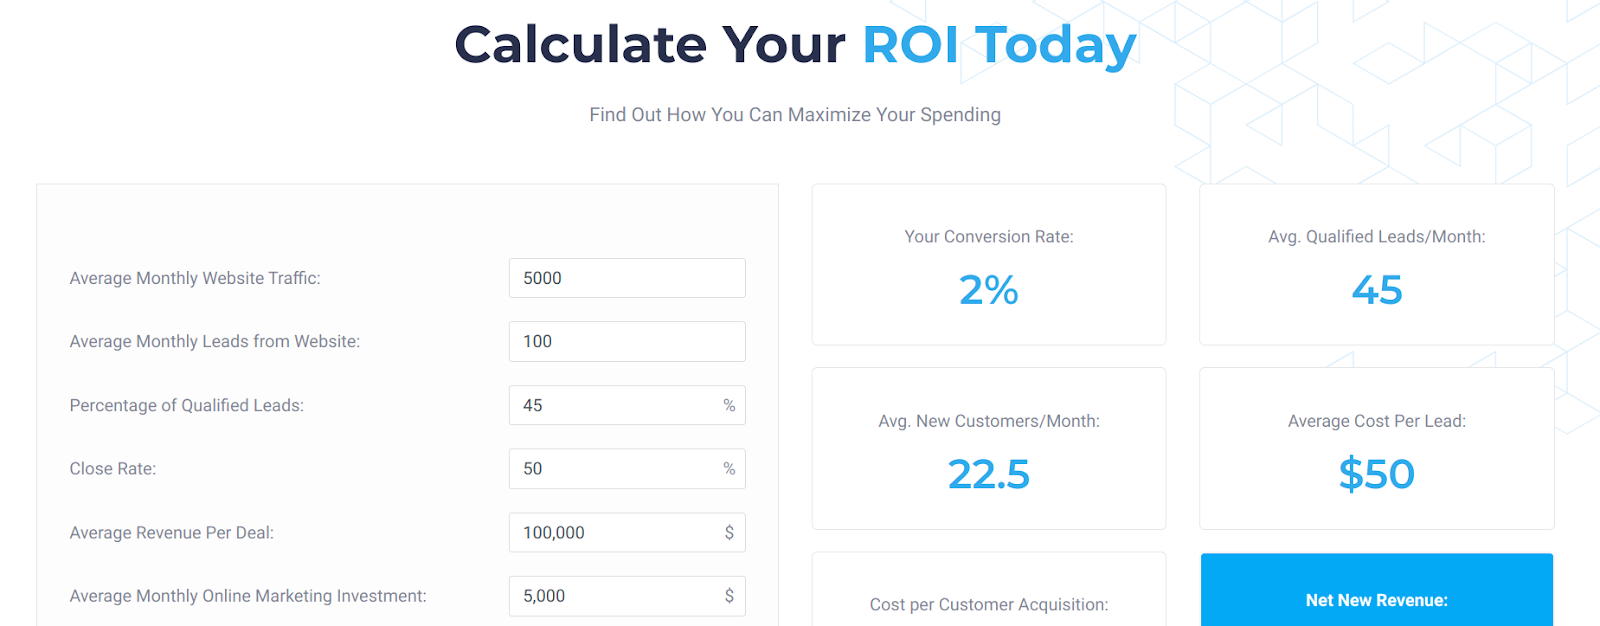
After collating your marketing and revenue data, a B2B marketing ROI calculator can make the next step easier. All you have to do is enter your data and get your ROI.
Beyond that, you can use this calculator when trying to create an ROI forecast. That’s why we have created a B2B marketing ROI calculator at OneIMS.
On this page, you can enter details such as:
- Average monthly website traffic
- Average monthly online marketing investment
- Average monthly leads from website
- Percentage of qualified leads
- Close rate
After entering these details, the calculator will automatically reveal numbers such as your conversion rates, cost per customer acquisition, net new revenue, and more.
Conclusion
Running marketing campaigns is a vital aspect of every B2B company. But just as important, you need to know how much your marketing spend contributes to your business’s bottom line.
By measuring B2B marketing ROI, you can determine if your marketing spend is as effective as possible. Furthermore, you can troubleshoot your marketing strategy to find new opportunities.
Whether you’ve been measuring ROI or just about to start, you can refer to the vital information in this guide. And if you need help calculating your marketing ROI, you can always reach out to us.


